


The state of decarbonization, 2025 edition
Some highlights (or lowlights, depending on the chart) from a climate change specialist's annual slide deck.

Veterans of Nuance Matters will recall last year’s post showcasing the work of the climate change guru Nat Bullard. The past five years he has produced an annual slide deck chock-full of charts documenting global decarbonization. This year’s edition was published at the end of January and runs a cool 200 slides.
Like last year, I have gone through the slides and pulled out sixteen (plus a bonus!) that I thought were particularly interesting or insightful that deserved special shout-out.
Slide 3 - Japan’s cherry blossom season has gotten earlier

Most of the time, the effects of climate change are a slow roll, best represented over the long-term. While it may be imperceptible during your lifetime, there has been a noticeable shift in the state date of Kyoto’s cherry blossom season.
Slide 17 - another year another record year for coal
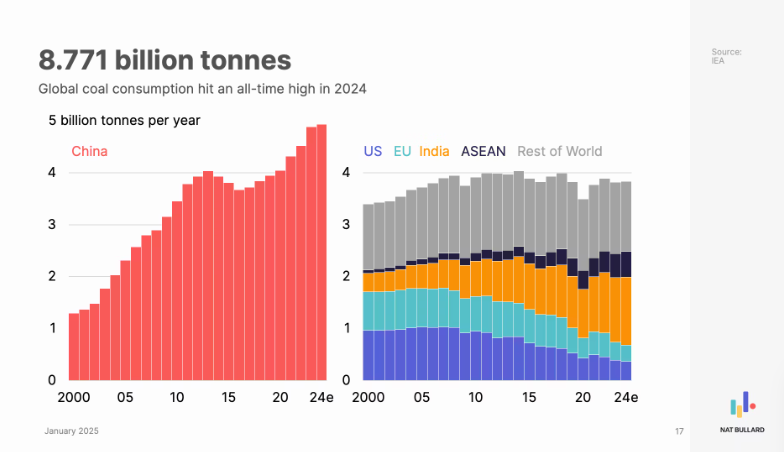
China’s coal consumption continued to climb in 2024 as the world hit another record level of coal usage. As lot of China’s coal power is from relatively young power plants, which portends stranded asset risk (the risk that assets are written off before the end of their useful life, signaling potential future economic troubles for these asset owners - refer to slide 113 for breakdown by age).
Slide 30 - NIMBYism in full effect across the United States

One of the biggest issues preventing renewable energy from taking off in the United States is ‘NIMBYism’ or ‘Not in My Backyard’. In 2023 and 2024, the number of local rules and regulations against renewables have sky-rocketed.
Slide 31 - US as net energy exporter

Since October 2019, the US has been a net energy exporter (thanks to the shale boom).
Quite the turnaround from the mid-2000s when the US was in the significant red as a net importer. Just imagine what Trump would want to do if that were still the case today!
Slide 44 - clean energy investment is going toward the more mature industries

Annual ‘energy transition’ investment exceeded $2 trillion for the first time in 2024, a respectable milestone that deserves to be recognized.
That being said, most of that money went to electric vehicle and renewables, two technologies that have already garnered a lot of investment. For the energy transition to have any hope of succeeding, more capital needs to find its way in less traditional investments like carbon capture and storage (CCS) to make these technologies more economically viable.
Slide 47 - the Trump Effect
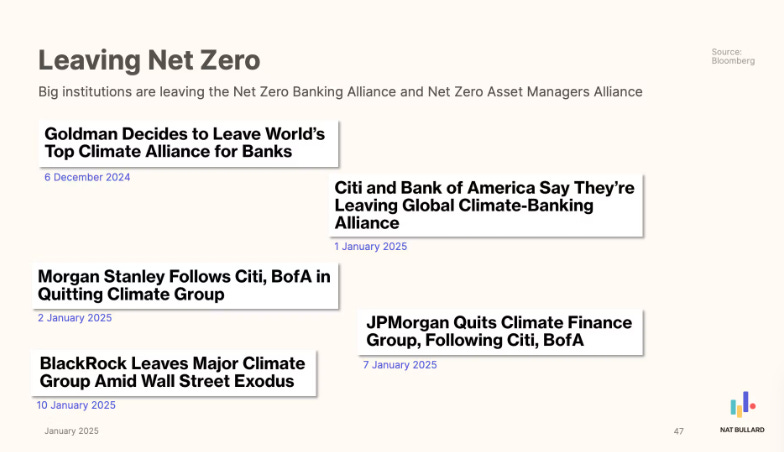
At COP26 held in Glasgow in November 2021, basically the height of the clean energy movement, large financial institutions joined groups advocating for climate finance. But as the political winds have shifted, so have the views on Wall Street.
At the end of 2024, some of the most prominent American financial institutions withdrew from these groups, signaling it was time for a change. Proponents argue leaving these groups will give these asset managers more flexibility…
sure, color me skeptical…
Slide 58 - not a great year for clean energy investors

The markets have not been kind to clean energy stocks.
Between inflation (increasing the cost of raw materials), high interest rates (increasing the cost of capital), and the changing political fortunes of clean energy adherents, these stocks have taken a walloping.
Slide 85 - did you know the sun shines and the wind blows in Texas?

You might now know it from the political posturing of their leaders, but Texas continues to invest in renewable energy. Solar and battery power in particular have really exploded.
Slide 100 - right now, solar is the path forward

Wind companies have had a difficult few years. But at the same time, solar investment is off and running. As this gets progressively cheaper, this is currently our best shot at widespread renewable adoption.
Slide 119 - China’s peak oil

Hybrids/EVs are now half of all car sales in China, the world’s largest auto sector.
The Hybrid/EV market is just seven years old — just imagine what this will look like in another seven years time.
Slide 133 - BYD has surged in Singapore

Bullard’s personal pick of the litter, this chart demonstrates the Chinese EV company BYD’s meteoric rise in Singapore. It is now the second most popular car company in the island nation, behind only industry stalwart Toyota.
Notice that as recently as one year ago, BYD was essentially at parity with Tesla. Just a reminder that youthful markets are fickle and subject to shift.
Slide 137 - manufacturing is the big investor

Power companies continue to slowly invest. The real story is that US manufacturing companies have recently started to invest gobs of money.
Slide 143 - don’t confuse announcements with actions

A lot of companies (and countries, too) announce ambitious plans to invest across a series of projects. These announcements typically elicit media coverage and can be viewed more broadly as trends.
But follow-through on actually implementing the plans is required, or else its just a lot of hot air.
Slide 145 - SAF use is not very widespread
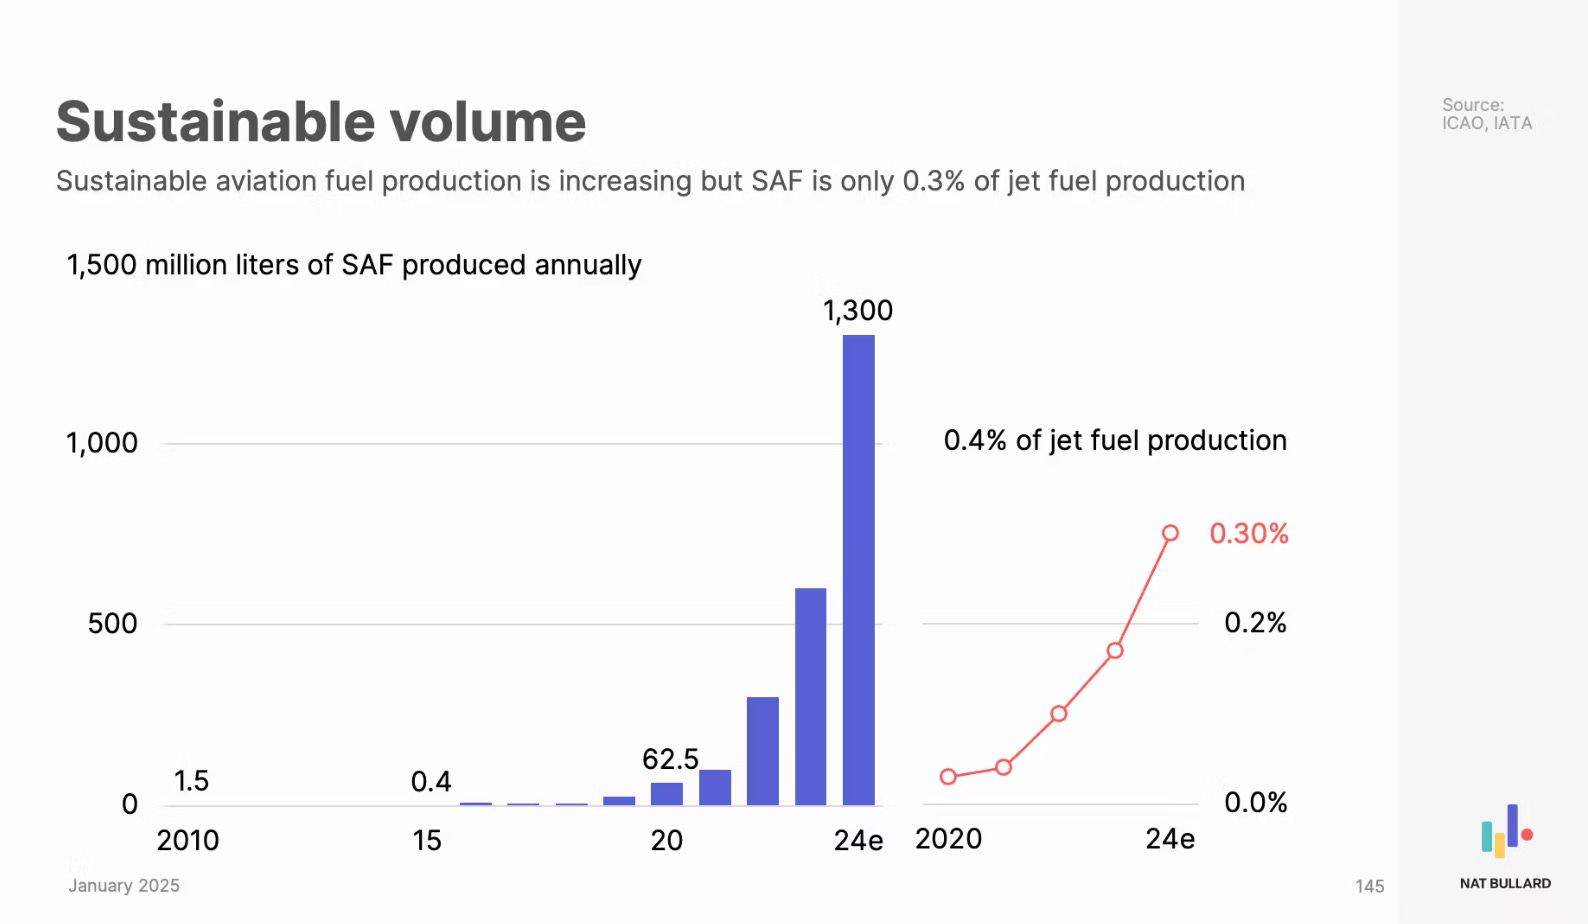
Just 0.3% of the jet fuel produced last year was sustainable aviation fuel (SAF). The gross number of liters produced in 2024 was more than double the amount produce in 2023, so that’s good. But as more of the world becomes mobile, SAF production has to become more commonplace.
Free idea: Charge private jets and business accounts punitive carbon taxes to help fund this investment??
Slide 185 - energy demand is going to increase across the board

Data centers supporting AI usage generate a lot of headlines, but electricity demand is expected to rise across industries for the rest of the decade.
Slide 188 - let’s invest in fridges

As parts of the world endure famine-like conditions, millions of tons of food goes to waste every year because of insufficient refrigeration. Not only is this a blight on our capacity to help others, but it has a severe climate impact.
The University of Michigan recommends investing in more advanced refrigeration to more seamlessly transport perishable goods around the world, and help alleviate some of the climate justice issues present today.
*****************
**BONUS**
Despite the presence of the La Niña cooling cycle, January 2025 was the hottest January on record.

Scientists feel that we are now at the beginning of a period of years where the average temperature will exceed 1.5C, with the occasional cooler year tossed in to keep the climate deniers at bay.
Thank you for taking a read through these charts. I know that there is a lot of information out there, but I think this is a good summary of what is actually going on right now.
If you are interested in decarbonization, or even the state of play in a wide array of climate-related sectors, I highly recommend taking a flip through this deck. You may even recognized a few charts from previous discussions here at Nuance Matters 😊.